Thursday, August 24, 2006

IV/Underlying Correlation

Devising an accurate options model can be tricky, particularly when IV is actually dependent upon price movements. This phenomenon is well known, and measurable in the Volatility Index (VIX) (it's ocasionally called the "fear index" by CNBC) for the S&P 500.

In general, large down moves in the S&P 500 will be met with correspondingly large up moves in the IV of options. At an extreme, during the stock market crash in 1987, the price of calls actually went up despite a 20% drop in the S&P.

Black (the offshoot of Black-Scholes designed for futures) assumes volatility as an independent input. With dependent volatility, delta-neutralizing portfolios becomes a challenge! Assume a delta neutral ES position. A 10 point drop in the underlying may result in a $2 loss, whereas a 10 point rise in the underlying may result in a $1 gain, solely because of the IV change. Obviously, a "delta-neutral" portfolio of ES options must actually be substantially delta-negative using the Black model.

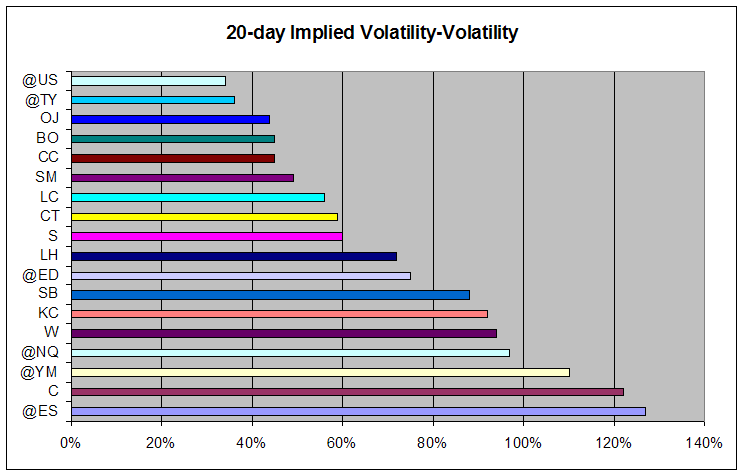
A look at the correlation of the underlying to its IV is helpful:
A correlation of 1.0 means the IV moves proportionally to the underlying. A correlation of -1.0 means the IV moves inversely proportionally to the underlying. The closer the correlation is to 1 or -1, the more predictable the movement of IV compared to the underlying.

As you can see, Russell (ER), Dow (YM), and S&P (ES) all have statistically significant IV movements opposite the underlying. (i.e. a rally will cause IV to drop). On the other side, Coffee (KC), Wheat (W), and Corn (C) have statistically significant IV movements along with the underlying (a rally will cause IV to rise).

In short, the index components need substantially delta-negative portfolios to be properly hedged while coffee and the two grains need substantially delta-positive portfolios.

These relationships are dynamic. Corn, for example, may have a correlation near 1 out of fear that a bad crop will cause substantial price increases, but a good crop will probably not cause too much of a price drop. During periods with limited reserves and high corn prices, the correlation would likely be the opposite. Presumably, if surprise Fed interest rate drops were more common than stock market crashes, the ES correlation would flip as well.

The ideal would be to modify Black to take into account these correlations to result in a truly hedged portfolio. If this work has been done, please tell us about it!

Saturday, August 12, 2006

dTheta/dT

A graph of theta over time, especially comparing strikes, reveals some interesting effects.
The various curves show the theta for call options when the underlying is unmoving at 1300. Notice something interesting? There's a point at which the market "gives up" on a particular option--the odds of it coming into the money just get exponentially worse, which causes theta to drop off.

This chart shows the point at which theta's Rate Of Change (or dTheta/dT) goes negative. In this case, the market "gives up" on the 1340 call (40 points out of the money) 13 days before expiration.

Trading options is almost exclusively about risk management. Looking at dTheta/dT reveals the balance point between probabilistic risk and reward.

One way of using this:
  1. Sell options which are on the verge of being "given up" upon. You receive an instantaneous maximum theta, but delta and gamma are quickly dropping. Your risk is directly proportional to gamma (notice how SPAN margins penalize you for having high negative gammas, no matter how far away from the money you are). Delta quickly decaying means you'll have to make fewer position adjustments. In other words, you're finding the point at which risk is at its maximum decay and your position will be easiest to manage.
  2. Buy back short options which no longer have enough theta to be worthwhile and roll into strikes which meet the criteria of #1. While your risk is decreasing, so is your earnings/short contract (and earnings/short contract may be the single most important parameter to optimize when short!)
Of course, there are arguments against this approach. The most compelling is that the Black-Scholes model (upon which theta here is computed) does not properly account for the leptokurtic movement of prices. Various authors (including Benoit Mandelbrot in The (Mis)behaviour of Markets and Nasim Taleb in Fooled by Randomness) argue that you can win in the long term by buying extremely out-of-the-money (OTM) options. You'll lose 95%+ of the time, but the one time you win, you'll win big enough to make up the difference. In the case of Nassim Taleb, he made his money buying extremely OTM options right before the 1987 stock market crash.

Personally, I'm positive of leptukurtosis in stock pricing, but that it's just another risk to manage when selling options (and a measurable, compensatable one).

Friday, August 04, 2006

IV volatility

While on the subject of second derivatives, ever thought about the volatility of IV?

43% IV on Coffee on 7/5 is near a very long term high. If you had purchased an ATM straddle on 7/5, and held it to 7/21, you would have lost .95 despite a rapid 8% drop in Coffee's prices. On the other hand, if IV had stayed a constant, you would have made .25 in the same time period.

There are a variety of pure Vega trades which can make money no matter what the underlying does. Identifying targets for these types of trades requires a peek at the Volatility of the IV (IVV, to make up a term). A very low IVV means you can almost ignore IV and play purely on price action. A very high IVV means you better pay close attention to IV and its historical range before enterting a trade.

IVVs are pretty widely variable, but there are a few surprises. The S&P's IVV is substantially greater than the Nasdaq's, for example.

@ES having the highest IVV is particularly illuminating. In these days leading up to the fed meeting, IV is having far more impact on @ES option pricing than the small underlying price movements.

Thursday, August 03, 2006

Where's the Action?

Futures Options are less frequently traded than Equity Options. So, where's the action?

Pit:

Electronic:
These charts show the total volume traded during the month of July on the front 3 months of option contracts. I intentionally left Eurodollars off the pit traded chart as it had a total of nearly 1M contracts.

Of course, volume alone doesn't make a contract worthwhile to trade. Margin requirements, commissions, tight spreads, and the strike density all contribute to the "tradeability" of a contract.

A good example of the importance of strike density is @TY (the 3rd most active electronic contract). On a "big day", @TY will typically cross a whopping 1/2 of a strike. @ES, on the other hand, will cross 3-4. The more strikes crossed, the easier it is to adjust a position.

Commissions can dramatically change the results. The best pit traded commissions I've seen so far are $7 each way through RJ O'Brien. @ES contracts are $1.65 each way through IB. Adjusted for equivalent risk, you may have to trade 10 Corn contracts for every 2 @ES contracts. This means paying $70 in commissions vs $3.30.

Commissions inclusive, on an equivalent risk-adjusted basis, some pit-traded options have historically offered much better reward than most electronic contracts.

Futures Options

Derivatives of derivatives, oh my!